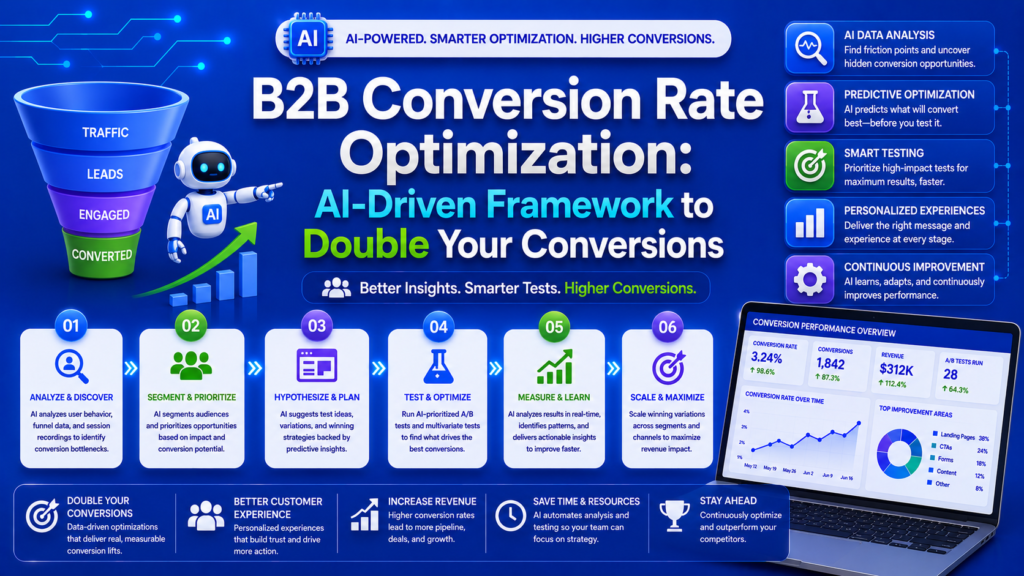
Featured Snippet Target: B2B conversion rate optimization (CRO) uses AI to systematically test and improve website conversion rates through: (1) heatmap and session recording analysis to identify friction points, (2) AI-powered A/B testing of headlines, CTAs, forms, and page layouts, (3) dynamic personalization based on visitor attributes, (4) predictive lead scoring to optimize form fields, and (5) multi-variate testing that AI runs 10x faster than manual approaches.
The average B2B website converts 2-3% of visitors into leads. That means 97% of your marketing investment in driving traffic is wasted on visitors who leave without engaging.
CRO is the highest-ROI marketing activity available. Doubling your conversion rate from 2% to 4% doubles your leads without spending an additional dollar on traffic. AI makes CRO faster, more scalable, and more effective.
The CRO Audit Framework
Before testing anything, understand where conversions are breaking. This audit takes 2-3 hours and reveals your biggest opportunities.
Step 1: Funnel Analysis
Map your conversion funnel and measure drop-off at each stage:
Typical B2B website funnel:
- Session start (100%)
- Key page visit—product, pricing, case study (30-50%)
- CTA interaction—button hover/click (10-20%)
- Form view (5-15%)
- Form start (3-10%)
- Form complete (1-5%)
Where are your biggest drops? The largest percentage drop between stages is your biggest optimization opportunity. Fix the leakiest stage first.
Step 2: Behavioral Analysis
Install heatmapping and session recording tools (Hotjar, Microsoft Clarity) and collect 2 weeks of data:
Heatmap analysis questions:
- Do visitors see your primary CTA? (scroll depth data)
- Are visitors clicking non-clickable elements? (click heatmap)
- Which content sections get the most attention? (attention heatmap)
Session recording insights:
- Where do visitors hesitate or show confusion?
- Do they scroll past your CTA without noticing it?
- Are form errors causing abandonment?
- Do mobile visitors have a different experience than desktop?
Step 3: Technical Performance Audit
Slow pages kill conversions. Check:
- Page load time (target: under 3 seconds)
- Core Web Vitals (LCP, INP, CLS all in “Good” range)
- Mobile responsiveness (60%+ of B2B research starts on mobile)
- Form functionality (test every form on every browser and device)
The AI-Powered Testing Playbook
Test Priority Matrix
Test elements in this order for maximum impact:
|
Priority |
Element |
Typical Lift |
Time to Test |
|---|---|---|---|
|
1 |
Headlines |
20-50% |
2-3 weeks |
|
2 |
CTA buttons (text, color, placement) |
10-30% |
2 weeks |
|
3 |
Form design (fields, layout) |
15-40% |
3-4 weeks |
|
4 |
Social proof placement |
10-25% |
2-3 weeks |
|
5 |
Page layout and structure |
15-35% |
4 weeks |
|
6 |
Personalization |
40-100% |
4-6 weeks |
|
7 |
Pricing page design |
20-50% |
4 weeks |
|
8 |
Navigation and user flow |
10-20% |
4-6 weeks |
AI Testing Methodology
Traditional A/B testing: Test variant A vs. variant B. Wait for statistical significance. Implement winner. Repeat.
AI-powered testing: Test 10-20 variants simultaneously using multi-armed bandit algorithms. AI automatically shifts traffic to winning variants in real time, reaching statistical significance faster and reducing opportunity cost.
Key AI testing tactics:
- AI headline generation. Generate 20+ headline variations covering different angles (benefit-focused, problem-focused, social proof, specificity). Let AI testing determine which resonates.
- Dynamic CTA optimization. AI tests CTA text, color, size, and placement simultaneously. Different combinations may win for different audience segments.
- Form field optimization. AI determines the optimal number of fields for each visitor segment. High-intent visitors may tolerate more fields; low-intent visitors need fewer.
- Image and visual testing. AI tests product screenshots vs. customer photos vs. illustration vs. video. Results vary significantly by audience.
Conversion Optimization by Page Type Homepage
- Clear value proposition in 5 seconds or less
- Single primary CTA (not 3 competing options)
- Social proof visible without scrolling
- Segment-based paths: “For Enterprise” / “For Small Business”
Product/Solution Pages
- Feature-benefit format (not just feature lists)
- Comparison tables vs. alternatives
- Demo or free trial CTA prominently placed
Blog Posts
- Content upgrade CTAs matched to the topic
- Exit-intent popups with relevant lead magnets
- In-content CTAs after the first major section
- Author bio with credentials (builds E-E-A-T trust)
Pricing Pages
- Annual pricing displayed by default (higher revenue per customer)
- Most popular plan visually highlighted
- FAQ section addressing pricing objections
- “Contact sales” option for enterprise with custom pricing
The Bottom Line
CRO is not a one-time project. It is an ongoing optimization program. The companies achieving 7%+ conversion rates did not get there with one test, they got there with a systematic testing program that runs continuously.
AI accelerates the entire process: more variations tested, faster statistical significance, and personalization that multiplies the impact of every optimization.
At Expert Written Marketing, we build CRO programs for B2B companies that double conversion rates within 6 months. Want to double your website conversions? Get a free CRO audit from Expert Written Marketing.